Economic weight shifts north as Collin and Denton outgrow Dallas County
Collin County's share of the combined real GDP of Dallas, Collin, Denton and Ellis counties has climbed to 20.4% from 15.1% at the start of last decade.
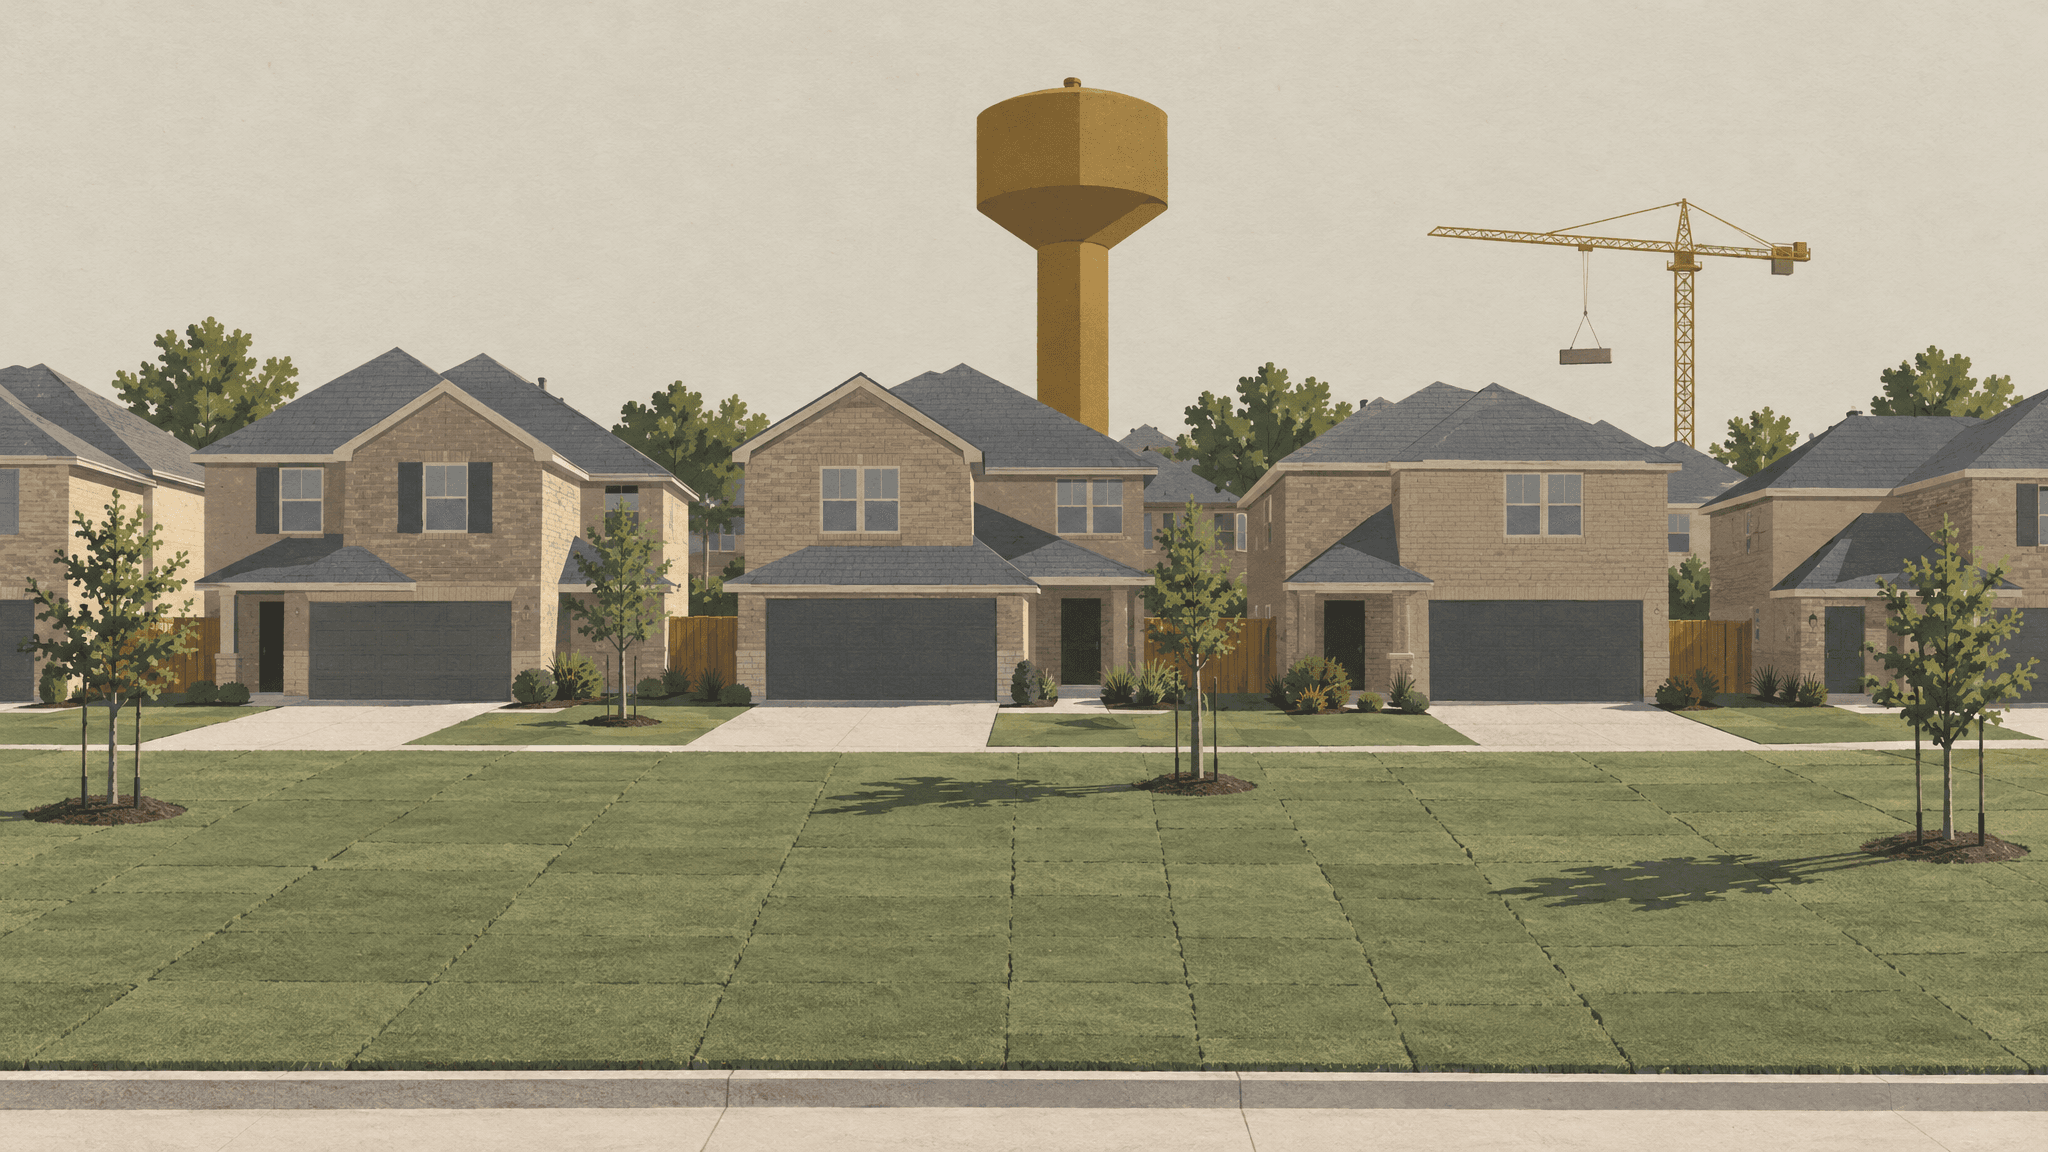
Collin County's economy has pulled well ahead of Dallas County's since the pandemic. It still didn't win the race.
Among Dallas, Collin, Denton and Ellis counties, the top spot for real economic growth from 2019 to 2024 went to Denton County, which finished a hair ahead of Collin, according to county gross domestic product estimates from the U.S. Bureau of Economic Analysis. Dallas County, the region's core, ranked fourth, last in the group.
Adjusted for inflation, Collin's GDP grew 38.2% over that stretch. Dallas County's grew 15.7%. That is a gap of 22.5 percentage points between the core county and its largest suburban neighbor in this comparison.
Denton County grew 38.3%, good for first place. Ellis County grew 26.2%, faster than Dallas County but well short of the northern pair.
This was not a one-year spike. Measured from 2019 through 2023, Collin's real GDP was already up 31%, against 14.2% for Dallas County. The gap then widened in 2024. Those earlier years are not set in stone: with the 2024 release, the agency revised its county estimates for 2020 to 2023 (U.S. Bureau of Economic Analysis (BEA)), so older published growth rates may not match these.
Dallas County still adds the most dollars
Percentages flatter a smaller base. Counted in output, Dallas County's real GDP rose by 42.3 billion chained 2017 dollars from 2019 to 2024. Collin's rose by 26.2 billion chained 2017 dollars.
So the core is still the bigger engine. It is growing more slowly from a much larger starting point, and in raw terms it still added more activity than its fast-growing neighbor.
For employers, landlords and anyone weighing where to open a shop or sign a lease, both facts count. The largest pool of economic activity remains in Dallas County. The fastest growth is to the north, where the suburbs keep pushing outward.
A smaller slice for the core
Over time, that difference in pace has reshaped the map. In 2010, Dallas County produced three-quarters of the combined real output of these counties. By 2024, its share had slipped to just over two-thirds.
Collin picked up much of the difference, rising from 15.1% of the total in 2010 to 20.4% in 2024, or just over 1 in 5 dollars. Denton accounted for 10.8% in 2024.
Collin's run started before the pandemic. An earlier BEA report named it the fastest-growing large county in its region, with finance and insurance as the leading contributor (U.S. Bureau of Economic Analysis (BEA)). That region covers Arizona, New Mexico, Oklahoma and Texas (U.S. Bureau of Economic Analysis (BEA)).
Tracking all of this has gotten harder. The agency has discontinued publication of statistics for metropolitan areas (U.S. Bureau of Economic Analysis (BEA)), which leaves no official GDP figure for the Dallas–Fort Worth metroplex. Any regional picture now has to be assembled county by county, and assembled that way, the growth is landing north of the Dallas County line.
About the data
We used the U.S. Bureau of Economic Analysis county GDP estimates, updated in February 2026, measured in chained 2017 dollars to remove inflation. For Dallas, Collin, Denton and Ellis counties we calculated percent and dollar change in real GDP from 2019 to 2024, ranked the counties by percent growth, and computed each county's share of their combined output in 2010 and 2024. We repeated the growth comparison with 2023 as the endpoint to check that the result did not hinge on a single year.
- The comparison covers only Dallas, Collin, Denton and Ellis counties and leaves out Tarrant and other counties, so it is not a picture of the whole metroplex.
- County GDP measures output produced inside a county's borders, not the income of the people who live there, so it does not show how residents' paychecks changed.
- BEA revised its 2020 to 2023 county estimates with this release, and future revisions could shift these growth rates.
Real GDP: the value of goods and services produced in a county, adjusted to remove the effect of rising prices. Chained 2017 dollars: BEA's method for expressing output in constant 2017 prices so different years can be compared fairly.
Sources
- Federal Reserve Bank of St. Louis (FRED): Real Gross Domestic Product: All Industries in Dallas County, TX, latest period 2024, released Feb. 5, 2026; retrieved Oct. 17, 2026. Data
- Federal Reserve Bank of St. Louis (FRED): Real Gross Domestic Product: All Industries in Collin County, TX, latest period 2024, released Feb. 5, 2026; retrieved Oct. 17, 2026. Data
- Federal Reserve Bank of St. Louis (FRED): Real Gross Domestic Product: All Industries in Denton County, TX, latest period 2024, released Feb. 5, 2026; retrieved Oct. 17, 2026. Data
- Federal Reserve Bank of St. Louis (FRED): Real Gross Domestic Product: All Industries in Ellis County, TX, latest period 2024, released Feb. 5, 2026; retrieved Oct. 17, 2026. Data
More from the Standard


The Dallas Standard in your inbox
The week’s North Texas news, every Sunday. Free.
0 Comments
Sign in with a free account to join the conversation.
Loading comments…